AZTool
A software program for automated zone design
Use Cases
Below are some examples of applications of AZTool in various sectors. We are always fascinated to hear what people have been using AZTool for. If you have employed AZTool, for any purpose, please do get in touch with us.
Designing an entirely new set of zones: the 2001 Census residential output geographies
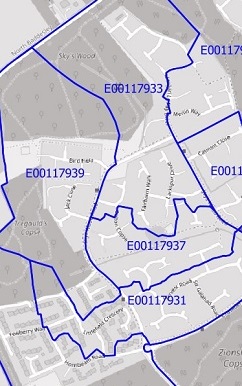
A predecessor of AZTool revolutionised the creation of output geographies for the 2001 Census in England and Wales. Prior to the 2001 Census, the zones used for collection and publication of census data (Enumeration Districts) were the same, and the boundaries of these zones were designed using semi-automated methods and paper maps. Martin et al (2003) capitalised on Geographic Information Systems (GIS) and digital boundary data to automate the process of designing zones. The Office for National Statistics (ONS) implemented these methods to produce zones specifically designed for the publication of census data, trading off the competing requirements of confidentiality, minimising variation in population size between zones, maximising social homogeneity within zones, and nesting zones within local authority boundaries. The use of automated zone design methods made this process more efficient and the outputs more effective for mapping and analysing statistics. These residential-based output geographies (termed Output Areas and Super Output Areas) have gone on to become the statistical building blocks for the Government Statistical Service (GSS) Geography Policy and underpin a vast range of evidence-based mapping and policy generation across multiple sectors, including the 2015 and 2019 English Indices of Deprivation and Travel to Work Areas.
Modifying (‘maintaining’) existing zones due to population change: the 2011 Census residential output geographies
AZTool can be used to update a set of existing zones where there have been changes in the underlying phenomena being mapped. For example, in order to create the 2011 Census residential-based output geographies, ONS employed AZTool to split, merge or retain the existing 2001 Output Areas (OAs) and Super Output Areas (SOAs). This allowed them to amend the zones in areas where there had been significant population change, whilst simultaneously maintaining confidentiality and minimising boundary changes. The resulting ‘maintained’ zones provided the first stable set of zones across multiple censuses, facilitating analysis through time.
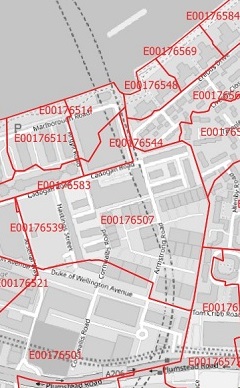
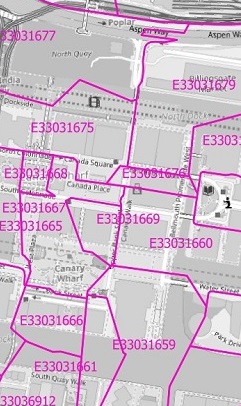
Modifying existing zones for a new purpose: the 2011 Census Workplace Zones
For the 2011 Census, ONS employed AZTool to generate a new set of zones called Workplace Zones (WZs). These were designed specifically for the publication of workplace-related data collected in the Census, and were produced by splitting, merging or retaining the existing residential-based Output Areas. As a direct result of this more bespoke design, ONS were able to publish 21 detailed tables of demographic and employment data for workers and workplaces in each of the 53,578 WZs, compared to just four such tables released for Output Areas (OAs) from the 2001 Census due to the difficulty of ensuring confidentiality. Following positive user feedback and strong demand for UK-wide statistics, National Records of Scotland (NRS) and Northern Ireland Statistics and Research Agency (NISRA) requested the creation of WZ boundaries for Scotland and Northern Ireland. These were produced by ONS in collaboration with the AZTool team. The Central Statistical Office subsequently produced their own set of WZs for the Republic of Ireland, and WZs now form the basis for policy and planning in various sectors, including business, central and local government. There is also a series of geodemographic Classifications of Workplace Zones, for the UK, England and Wales, and London.
Maintaining existing zones: the 2021 Census residential and workplace output geographies
Consultations by ONS in the run up to the 2021 Census showed strong user support for retaining Output Areas, Super Output Areas and Workplace Zones as the building blocks for the output geography hierarchies. ONS are therefore once again employing AZTool to design these geographies, using administrative data to modify the zones where necessary ahead of the census, and then fine-tuning the zones once the full census data is processed. The current version of AZTool and its predecessors will therefore very soon have made a key contribution to the design of output geographies for three censuses!

Creating zones to manage fieldforce workloads: collection geographies for the 2021 Census and 2021 Census Coverage Survey
Recent enhancements to AZTool include the ability to aggregate building blocks based on measures of connectivity. One application of this is the design of more efficient and effective workload areas for the collection of data in the field. In collaboration with the AZTool team, ONS exploited this new functionality to design Coordinator Areas for managing workloads of field staff for the 2021 Census and Interviewer Areas for the 2021 Census Coverage Survey. The ability of AZTool to rapidly and repeatedly design zones using different criteria was also employed by ONS to evaluate different sample designs and associated cost implications for the 2021 Census Coverage Survey, informing the decision to retain a two-stage sampling method based on OAs and postcodes.

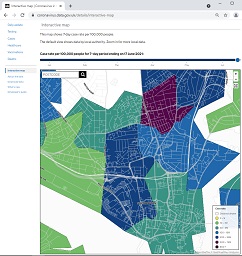
COVID-19 national response based on official statistics
The Office for National Statistics (ONS) and the Joint Biosecurity Centre (JBC) continue to exploit the unique perspectives provided by the Workplace Zone (WZ) and Super Output Area (SOA) geographies to inform national response to the COVID-19 pandemic. Industry-related COVID-19 risk has been estimated using data for WZs and this has been combined with data on residential areas for SOAs to inform local lockdowns. COVID-19 risk indices have been produced at SOA level and used to inform targeted sampling to detect virus RNA in wastewater to provide early warnings of outbreaks. Middle Layer Super Output Areas (MSOAs) form the basis for key interactive maps of COVID-19 prevalence, helping to inform both organisations and the public about current and past risk.